RSI Overbought: How to Screen for the Mean-Reversion Fade
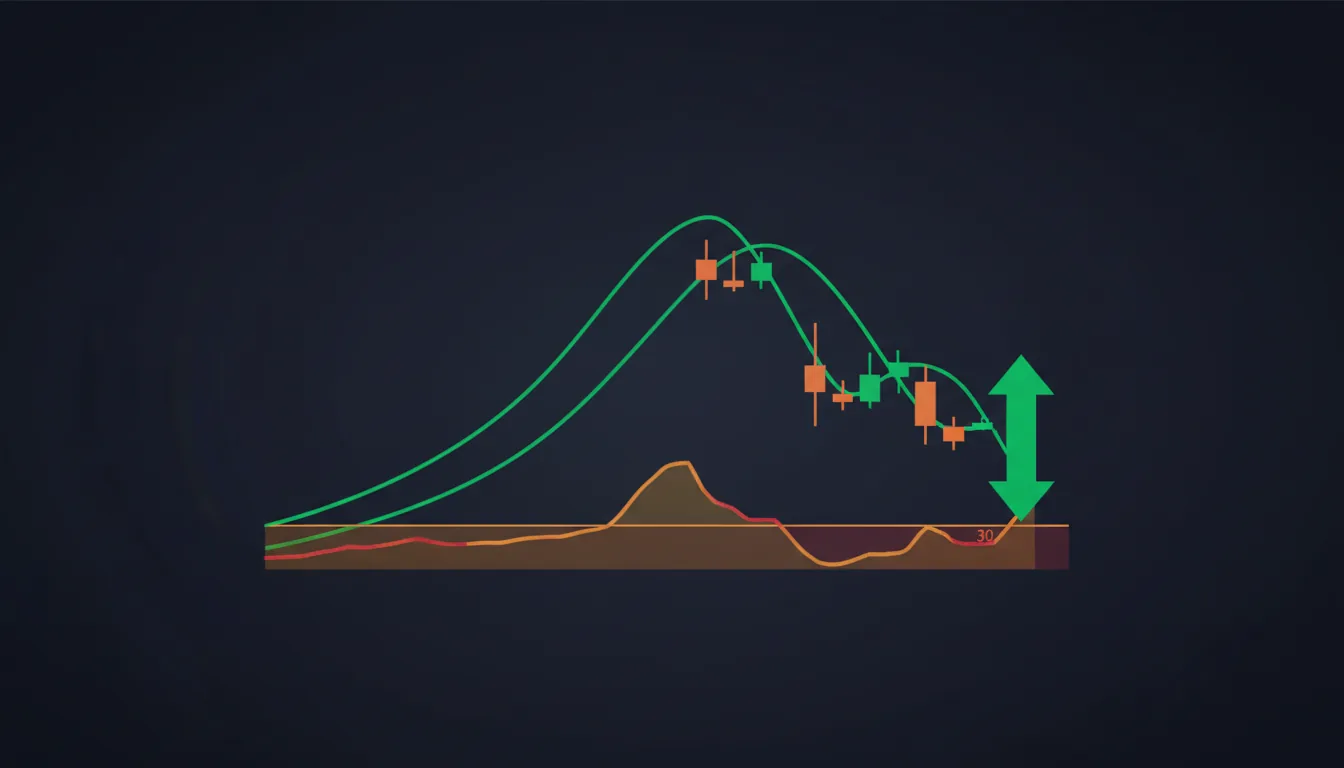
When RSI(5) spikes above 70 on three consecutive rising days in a stock below its 200-day moving average, the theory says the bounce is running on borrowed time — the short-term overbought fade Larry Connors & Cesar Alvarez documented in Short-Term Trading Strategies That Work (2008).
Honest status note: EasySwing tested RSI Overbought through our out-of-sample permutation sweep, and it did not clear our selection-edge bar. It is retired from the active picks — part of our strategy graveyard, not the live scanner. This guide keeps the mechanism because it is worth understanding, but treat it as education, not a live edge, and do not read a headline win rate into it. Live, tracked stats for the strategies that did clear the bar are on the performance page.
This is the short-side complement to RSI Mean Reversion: The Oversold Bounce — same Connors RSI(5) framework, opposite direction.
For a complete overview, see our guide to technical analysis swing trading.
What RSI Overbought Means in Practice
RSI(5) above 70 identifies a specific short-term state: a stock that has risen sharply over five sessions, pushing its momentum reading into overbought territory, without the trend structure to sustain that move. The standard RSI period is 14; EasySwing uses RSI(5) because the faster window fires sooner and is more precise for mean-reversion timing.
For RSI(14), crossing 70 often reflects genuine momentum. For RSI(5), the same reading is more likely to reflect exhaustion — a short-term burst that is running out of buyers. Connors & Alvarez (2008) tested multiple periods across 25+ years of S&P 500 data and found RSI(5) and RSI(2) generated the clearest short-term overbought edges, with the reversal tendency strongest over 2–5 day windows.
Why Overbought Stocks in Downtrends Tend to Reverse
Mean reversion in short-term stock returns is well-documented. De Bondt and Thaler (1985, Journal of Finance) showed that extreme short-term winners systematically underperformed over subsequent measurement periods — a finding that held across individual stocks and diversified portfolios. At the swing-trade timeframe, Jegadeesh (1990, Journal of Finance) documented statistically significant weekly return reversals, attributable to temporary price pressure from retail participants and liquidity-providing market makers.
The mechanism in RSI Overbought setups is specific: when a stock in a primary downtrend (below SMA200) stages a sharp multi-day bounce, it attracts short-term traders and short-covering — not institutional accumulation. Volume during these bounces typically runs below average, confirming the absence of new buying demand. Without buyers willing to pay progressively higher prices, the bounce stalls and the stock returns to its prior trend.
The same principle applies to overextended stocks (price more than 10% above SMA50). When a stock detaches too far from its intermediate trend average, mean reversion is the natural corrective force. Connors & Alvarez found that stocks with RSI(5) above 90 showed the sharpest short-term reversal tendency in their historical dataset, and stocks above 80 showed clearly negative forward returns over 5-day windows.
According to Connors & Alvarez, stocks in a long-term downtrend (below SMA200) that have a short-term RSI(5) spike above 70 represent one of the highest-probability mean-reversion opportunities in their research — far more consistent than the same signal in uptrending stocks.
The Three-Condition Entry Trigger
EasySwing's RSI Overbought scan requires all three conditions simultaneously on the current market close:
Condition 1: RSI(5) above 70 The five-period RSI exceeds 70 — the primary exhaustion signal. This is not a trend-strength measurement; it marks a concentrated, short-duration push into overbought territory.
Condition 2: Three consecutive rising RSI days RSI(5) has moved upward on each of the three most recent sessions. This filter removes one-day spikes and confirms a sustained short-term push — the kind most prone to reversal as buying momentum runs out.
Condition 3: Price context — below SMA200 or overextended above SMA50 Either:
- The stock is below its 200-day simple moving average (primary downtrend context), or
- Price has extended more than 10% above the 50-day SMA (parabolic extension in any trend)
Both conditions identify the same underlying state: the bounce lacks structural support from the primary trend.
Volume gate: The bounce volume must stay below 150% of the 50-day average. High-volume bounces suggest institutional accumulation — a different market structure where the reversal thesis weakens significantly.
| Condition | Threshold | Rationale |
|---|---|---|
| RSI(5) | > 70 | Short-term overbought trigger |
| RSI rising days | 3 consecutive | Confirms a sustained, exhausted bounce |
| Price context | Below SMA200 or > 10% above SMA50 | Downtrend or overextension |
| Volume | < 150% 50-day average | Filters institutional buying |
How EasySwing Screens for RSI Overbought
At each market close, EasySwing checks every stock in the watchlist against all four conditions. When all trigger, the stock appears in the RSI Overbought screener column with:
- A setup grade (A, B, or C). Grade A requires clean conditions: RSI(5) well above 70, clearly below SMA200, volume contained. Grade B means one condition is marginal — for example, RSI(5) is at exactly 71, or the stock is right at the SMA200 rather than clearly below it.
- Pre-calculated entry, stop, and target levels based on ATR, so the risk parameters are visible before acting.
- A regime badge showing whether the current market environment supports the setup (TRENDING_DOWN or RANGING) or suggests caution (TRANSITIONING).
To set an alert, configure the RSI Overbought filter with a grade threshold of B or higher and the regime gate set to Trending Down or Ranging. When a qualifying stock appears at close, the Telegram notification fires immediately. For the full alert configuration workflow, see How to Set Up Swing Trading Alerts.
Stop Placement and Exit Criteria
Because RSI Overbought is a short-direction setup, stops sit above entry — the mirror image of long setups:
- Stop loss: 2.0× ATR above the entry price. This accommodates intra-day noise without allowing the trade to run against the position if the bounce extends briefly.
- Target 1 (T1): 1.5× ATR below entry. EasySwing takes 100% of the position off at T1 for RSI Overbought. The setup targets a mean-reversion move, not a sustained trend — exit at T1 rather than holding for T2 in most conditions.
- Target 2 (T2): 3.0× ATR below entry. Available for stronger trend-day moves in confirmed deteriorating conditions.
Primary exit trigger: RSI(5) drops below 50. When the oscillator that fired the entry falls back through the midpoint, the short-term bounce has exhausted. Exit regardless of price level — this is the same RSI(5) that triggered the trade, reversed.
Trailing stop: 5% from the most recent swing low after entry. Maximum hold: 7 days. If T1 has not been reached within one week, close the position — the setup has stalled.
By design this is a low-R setup — it targets a contained bounce reversal, not a trending move. We do not publish a win rate or average R for it: in out-of-sample testing it did not clear EasySwing's selection-edge bar, so any headline figure would overstate an edge that is not there. For the strategies that are live-tracked, see the performance page.
For position sizing principles that apply here — including how to set risk per trade as a percentage of account equity — see Position Sizing and R-Multiples.
When RSI Overbought Works Best
Performance varies substantially by market regime. Checking the regime before acting on any signal is the primary filter that separates signal from noise.
| Regime | Directional fit (by design) |
|---|---|
| Trending Down | Best-aligned environment for a short-side fade |
| Ranging | Secondary — cleaner setups only |
| Transitioning | Marginal — reduce size |
| Trending Up | Avoid — momentum may extend |
| High Volatility | Avoid — wide ATR inflates stops |
These are directional-fit judgments from the setup's design, not published win rates — the strategy is retired from the active picks. The single most critical rule: never fade RSI Overbought in a trending-up market. In bull conditions, RSI(5) can stay above 70 for extended periods as institutional buyers drive sustained momentum — what looks like exhaustion is often continuation.
In confirmed downtrends, RSI Overbought pairs naturally with Bear Flag setups — both target bearish continuation, but Bear Flag uses pattern breakdown as the entry trigger while RSI Overbought uses oscillator exhaustion. In ranging markets where primary direction is unclear, the Swing Condor offers a direction-neutral alternative.
RSI Overbought Pre-Signal Checklist
Before acting on any RSI Overbought alert from EasySwing, confirm each item:
- ✅RSI(5) is above 70 on the current close
- ✅RSI(5) has risen on each of the last three sessions
- ✅Stock is below its SMA200, OR price is more than 10% above its SMA50
- ✅Bounce volume is below 150% of the 50-day average
- ✅Market regime is Trending Down or Ranging (check the regime badge)
- ✅Setup grade is B or higher
- ✅Position risk is within your standard allocation (1–2% of account)
- ✅No earnings announcement within the next 5 trading days
- ❌Do not act if the bounce has been high-volume — possible institutional accumulation or reversal
- ❌Do not act in a Trending Up or High Volatility regime
- ❌Do not act if RSI(5) has already started declining — the bounce must still be active at time of alert
Frequently Asked Questions
What makes RSI(5) better than RSI(14) for overbought signals? RSI(14) is a trend-following oscillator — it stays elevated for extended periods in uptrends and is poorly suited to mean-reversion timing. RSI(5) is a faster oscillator that fires more quickly and reverts more cleanly. Connors & Alvarez (2008) tested multiple periods across 25+ years of S&P 500 data and found RSI(5) and RSI(2) generated the most consistent short-term reversal edges, particularly on 2–5 day holding windows.
At what RSI level is a stock considered overbought for swing trading? EasySwing uses RSI(5) above 70 as the base threshold. Readings above 80 correlate with stronger mean-reversion edges — and typically produce A-grade signals in EasySwing's scoring model. Connors' research showed the sharpest reversal tendency at RSI(5) above 90, though these setups occur less frequently.
Why does the stock need to be below its 200-day SMA for this to work? Stocks above their SMA200 are in primary uptrends where RSI(5) overbought conditions frequently represent momentum continuation, not exhaustion. The SMA200 filter isolates stocks in downtrends where the short-term bounce lacks institutional backing and mean reversion is the statistically more likely outcome over the next 2–7 sessions.
How does RSI Overbought differ from RSI Mean Reversion Oversold? They use the same Connors RSI(5) framework in opposite conditions. RSI Mean Reversion (Oversold) identifies short-term dips in uptrending stocks (RSI(5) below 30 in stocks above SMA200) for a bounce. RSI Overbought identifies short-term bounces in downtrending stocks (RSI(5) above 70 in stocks below SMA200) for a reversal. The regime gates are mirror images: Oversold favors TRENDING_UP; Overbought favors TRENDING_DOWN.
What is a realistic expectation for this strategy's performance? The honest answer is that EasySwing does not publish one. In our out-of-sample permutation testing, RSI Overbought did not clear the selection-edge bar, so it is retired from the active picks and we will not attach a live win rate or R-multiple to it — that would overstate an edge that is not there. If you trade the mechanism discretionarily, keep position sizing at 1–2% risk per trade. For the strategies that are live-tracked, see the performance page.
EasySwing.trading automatically screens for RSI Overbought setups across 2,000+ US equities at each market close. For the complementary long-side RSI setup, see RSI Mean Reversion: The Oversold Bounce. To configure regime-gated alerts, see How to Set Up Swing Trading Alerts. Scan results are for informational purposes only. See our Risk Disclaimer.
Disclaimer: This article is for educational purposes only and does not constitute investment advice. EasySwing is a stock screening tool, not a registered investment advisor. All trading involves risk. Read our full disclaimer →