Swing Trading Strategies: 8 Setups for Every Market (Active and Retired)
According to a Jegadeesh and Titman (1993) study published in the Journal of Finance, momentum-based strategies returned 12.01% annualized over a 25-year sample -- and those returns have persisted in every subsequent decade of research. Swing trading strategies are the practical application of that edge: systematic methods for capturing 2-to-30-day price moves in individual stocks.
This guide covers eight swing trading strategies that span bull markets, bear markets, and everything in between. Each one has a defined entry checklist, stop-loss rule, and target -- no discretionary guessing required.
In This Guide
- VCP Setup: Volatility Contraction Pattern
- Cup and Handle Pattern
- Qullamaggie Breakout: The Continuation Setup
- Pullback to Rising MA
- RSI Mean Reversion
- Bear Flag Short Setup
- Swing Condor (Range-Bound Strategy)
- Power Earnings Gap (PEG)
- Position Sizing with R-Multiples
- Swing Trading vs Day Trading
What Is a Swing Trading Strategy
A swing trading strategy is a repeatable set of rules that tells you when to enter, where to place your stop, and when to take profit on trades lasting days to weeks. Unlike day trading, swing trading does not require constant screen time. Unlike buy-and-hold investing, it defines risk on every position.
The best swing trading strategies share three traits:
- Defined edge -- a statistical reason the setup works (trend continuation, mean reversion, or institutional accumulation)
- Clear entry trigger -- price action, volume, or indicator signal that removes guesswork
- Pre-set risk -- a stop loss placed before entry, with position size calculated from the risk amount
Mark Minervini, a two-time U.S. Investing Championship winner, notes in Trade Like a Stock Market Wizard (2013): "The single greatest edge a trader can have is a well-defined strategy executed with discipline." Every strategy below follows that principle.
Momentum Breakout Strategies
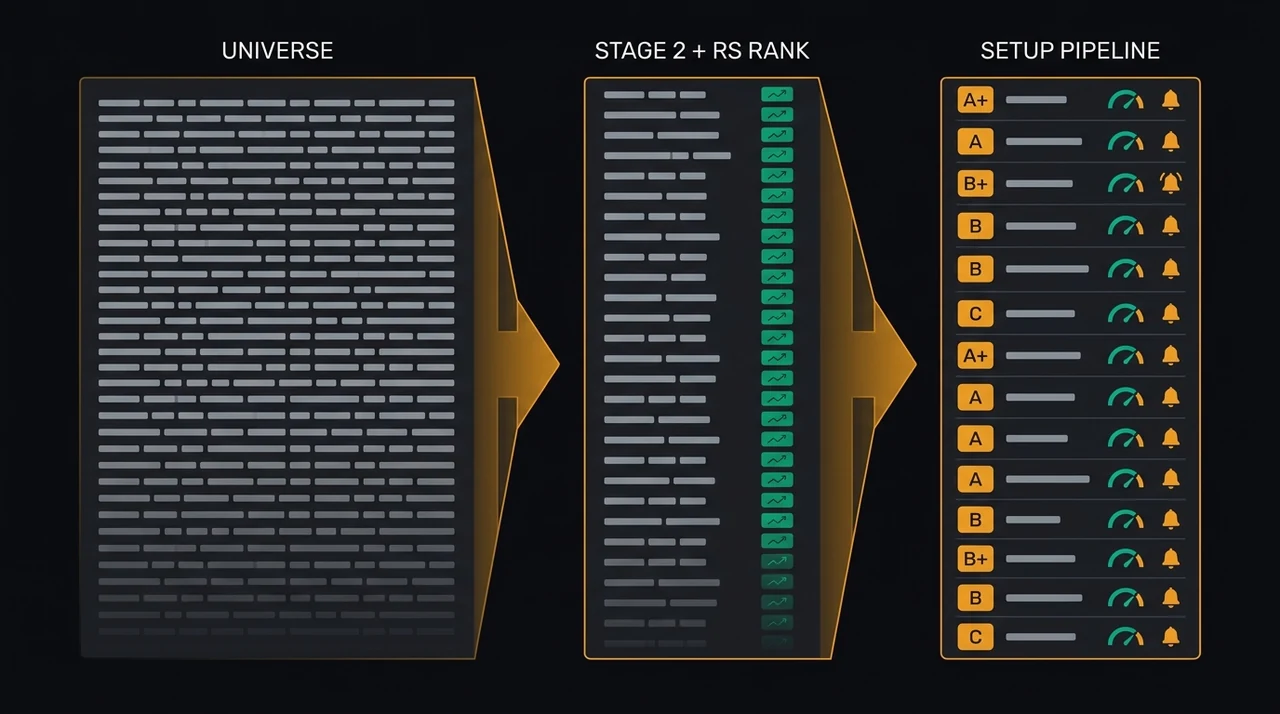
Momentum strategies buy stocks that are already strong and accelerating. Research by William O'Neil, documented in How to Make Money in Stocks (2009), showed that 9 out of 10 winning stocks broke out of a proper base pattern before their major advance. Two momentum setups dominate swing trading. For the broader context on selecting momentum candidates — including RS rank thresholds, volume filters, and pre-breakout screening steps — see Momentum Trading: How to Find Breakout Stocks Before They Run.
VCP Breakout
The Volatility Contraction Pattern (VCP) was developed by Mark Minervini. It identifies stocks in a Stage 2 uptrend that are forming progressively tighter consolidation ranges -- a sign of institutional accumulation.
| Attribute | Detail |
|---|---|
| Direction | Long |
| Hold time | ~11 days |
| Best regime | Trending Up |
| EasySwing status | Active pick — live win rate and avg R on the performance page |
Entry checklist:
- Price above the 50/150/200 SMA stack
- 3+ contracting pullbacks visible on the daily chart
- Volume drying up inside the base
- Breakout candle on 40%+ above-average volume
The VCP works because each contraction shakes out weaker holders while institutions build positions. When supply finally dries up, even modest buying pressure pushes the stock through the pivot. Read the full breakdown in our VCP Setup guide.
Cup and Handle
William O'Neil's Cup and Handle pattern is a Stage 2 breakout setup where a U-shaped consolidation (the cup) is followed by a shallow pullback (the handle) before a high-volume breakout.
| Attribute | Detail |
|---|---|
| Direction | Long |
| Hold time | ~16 days |
| Best regime (by design) | Trending Up |
| EasySwing status | Inconclusive — not currently in active picks |
Entry checklist:
- Prior uptrend of 30%+ before the cup
- Cup depth between 12% and 35%
- Handle in the upper 15% of the cup, depth under 12%
- Volume drying up in the handle
- Breakout above handle high on 40%+ above-average volume
- RS rank at 80 or above at breakout
The cup and handle is a classic bull-market breakout, but it did not reach a conclusive edge verdict in EasySwing's out-of-sample testing, so it is not currently one of the active picks. See our Cup and Handle full breakdown for the entry and management rules, and the performance page for live-tracked strategies.
Pullback and Trend-Following Strategies
Pullback strategies enter trending stocks on temporary dips -- buying the "sale" in an established uptrend. According to Kunal Desai's "Bone Zone" framework, the area between the 9-day and 20-day exponential moving averages is the highest-probability re-entry zone in a trending stock.
Trend Pullback (Bone Zone)
The Trend Pullback strategy enters when price dips into the EMA9/EMA20 zone during a confirmed uptrend, with declining volume confirming a healthy pause rather than distribution.
| Attribute | Detail |
|---|---|
| Direction | Long |
| Hold time | ~7 days |
| Best regime | Trending Up, Ranging |
| EasySwing status | Active pick — live win rate and avg R on the performance page |
Entry checklist:
- EMA9 > EMA20 > SMA50 stack intact
- Price touching or inside the EMA9/EMA20 zone
- RSI(14) between 40 and 55
- Volume declining during the pullback
- Bounce candle confirmation (close above prior day's high)
This strategy is the most versatile long setup -- it works in both trending and ranging markets, holding a positive expectancy even when conditions are choppy. For the complete framework, read Pullback to Rising MA.
Mean Reversion Strategies
Mean reversion strategies buy short-term weakness in stocks with long-term strength. Larry Connors, author of Short-Term Trading Strategies That Work (2008), documented that stocks with RSI below 10 returned an average of 3.8% within 5 trading days -- a statistical edge that has persisted for decades.
RSI Reversion (Oversold Bounce)
The RSI Reversion strategy enters when RSI(5) drops below 30 with three consecutive declining days in a stock that is still above its 200-day SMA. It exits when RSI(5) recovers above 50.
| Attribute | Detail |
|---|---|
| Direction | Long |
| Hold time | ~4 days |
| Best regime (by design) | Trending Up, Ranging |
| EasySwing status | Retired — did not clear the out-of-sample edge bar |
Entry checklist:
- Price above the SMA200
- RSI(5) below 30
- 3 consecutive RSI declining days
- Volume not spiking above 150% of average
RSI Reversion is a fast, high-frequency snapback setup, but this implementation did not clear EasySwing's out-of-sample selection-edge bar — it is retired to the graveyard, and we do not publish a win rate for it. See the full walkthrough in our RSI Mean Reversion guide.
Short-Selling Strategies
Short strategies profit when stocks decline. They become essential in bear markets and high-volatility regimes, when most long setups fail. Thomas Bulkowski's Encyclopedia of Chart Patterns (2021) documents the bear flag as one of the most reliable bearish continuation patterns, with a measured-move success rate above 60%.
Bear Flag
The Bear Flag is the short-selling mirror of the Trend Pullback. A stock in a confirmed downtrend bounces weakly into the EMA9/EMA20 resistance zone on declining volume, then breaks down.
| Attribute | Detail |
|---|---|
| Direction | Short |
| Hold time | ~8 days |
| Best regime (by design) | Trending Down, High Volatility |
| EasySwing status | Retired — did not clear the out-of-sample edge bar |
Entry checklist:
- Inverted EMA stack: EMA9 < EMA20 < SMA50
- Price bounced into EMA9/EMA20 resistance zone
- Price did NOT close above EMA20
- RSI(14) between 45 and 60 (weak bounce)
- Volume declining during bounce
- Breakdown candle confirmation
The bear flag is a short-side continuation pattern aimed at downtrend and high-volatility regimes, but this implementation did not clear EasySwing's out-of-sample selection-edge bar — it is retired to the graveyard, and we do not publish a win rate for it. Read the full setup in our Bear Flag guide.
RSI Overbought (Short)
The RSI Overbought strategy is the short-side mirror of RSI Reversion. It enters short when RSI(5) spikes above 70 with three consecutive rising days in a stock below its SMA200 or overextended above its SMA50.
| Attribute | Detail |
|---|---|
| Direction | Short |
| Hold time | ~4 days |
| Best regime (by design) | Trending Down, Ranging |
| EasySwing status | Retired — did not clear the out-of-sample edge bar |
Entry checklist:
- Price below SMA200 (or more than 10% above SMA50)
- RSI(5) above 70
- 3 consecutive RSI rising days
- Volume not spiking above 150% of average
This is a quick short-side mean-reversion trade aimed at temporary overbought spikes in weak stocks. This implementation did not clear EasySwing's out-of-sample selection-edge bar — it is retired to the graveyard, and we do not publish a win rate for it.
Range-Bound Strategy
Not every market trends. Stan Weinstein's Stage Analysis, described in Secrets for Profiting in Bull and Bear Markets (1988), identifies Stage 1 (basing) and Stage 3 (topping) as periods where stocks trade sideways. Range-bound strategies are designed to profit during these phases.
Swing Condor
The Swing Condor is a delta-neutral approach for stocks trapped in a horizontal channel. It defines an upper resistance wing and lower support wing, entering near the midpoint when ATR compresses.
| Attribute | Detail |
|---|---|
| Direction | Long (neutral bias) |
| Hold time | ~5 days |
| Best regime (by design) | Ranging, High Volatility |
| EasySwing status | Retired — did not clear the out-of-sample edge bar |
Entry checklist:
- Clear horizontal support/resistance channel on the daily chart
- ATR14 below the 20-day average ATR (compression)
- Price within 5% of channel midpoint
- RSI(14) between 40 and 60
- No earnings within 10 days
The Swing Condor was designed as a range-market instrument for when other strategies stall, but it did not clear EasySwing's out-of-sample selection-edge bar — it is retired to the graveyard, and we do not publish a win rate for it. For setup criteria and the entry checklist, see the Swing Condor full breakdown.
How to Choose the Right Strategy
Picking a strategy comes down to two factors: market regime and your directional bias. The wrong strategy in the wrong regime is the fastest way to lose money. According to research by Dimson, Marsh, and Staunton in the Credit Suisse Global Investment Returns Yearbook (2023), bear markets occur roughly 25% of the time -- so a trader with only long strategies is exposed one quarter of the year.
| Market Regime | Recommended Strategies |
|---|---|
| Trending Up (Bull) | VCP Breakout, Cup & Handle, Trend Pullback, RSI Reversion |
| Ranging (Choppy) | Trend Pullback, RSI Reversion, Swing Condor, RSI Overbought |
| Trending Down (Bear) | Bear Flag, RSI Overbought |
| High Volatility | Bear Flag, Swing Condor |
The mapping above is a by-design directional fit, not a list of active picks. Several of these setups — Cup & Handle, RSI Reversion, Bear Flag, RSI Overbought, and Swing Condor — are covered here for education but did not survive EasySwing's out-of-sample edge testing, so they are not in the current active set. The Strategies page shows which strategies are live in the current regime, and the performance page carries the tracked stats.
EasySwing.trading detects the current market regime automatically using breadth data, VIX levels, and trend indicators across a 5-state model.
Swing Trading Strategy Checklist
Before entering any trade, run through this checklist:
- ✅ Confirm the market regime supports your strategy direction
- ✅ Verify the stock's trend stage (Stage 2 for longs, Stage 4 for shorts)
- ✅ Check relative strength rank -- RS 80+ for longs, RS 40 or below for shorts
- ✅ Calculate position size using R-multiples (risk 1-2% per trade)
- ✅ Set your stop loss BEFORE entering the trade
- ✅ Define target levels (T1 and T2) based on ATR multiples
- ❌ Do not anticipate the signal -- wait for the confirmation candle
- ✅ Log the trade in your journal with entry rationale and screenshots
Strategy Comparison Table
| Strategy | Family | Direction | Avg Hold | Best Regime (by design) | EasySwing status |
|---|---|---|---|---|---|
| VCP Breakout | Momentum | Long | 11 days | Trending Up | Active pick |
| Cup & Handle | Momentum | Long | 16 days | Trending Up | Inconclusive — not currently active |
| Trend Pullback | Pullback | Long | 7 days | Trending Up | Active pick |
| RSI Reversion | Mean Reversion | Long | 4 days | Trending Up | Retired — did not clear edge bar |
| Bear Flag | Pullback | Short | 8 days | Trending Down | Retired — did not clear edge bar |
| RSI Overbought | Mean Reversion | Short | 4 days | Trending Down | Retired — did not clear edge bar |
| Swing Condor | Range-Bound | Neutral | 5 days | Ranging | Retired — did not clear edge bar |
Status reflects EasySwing's out-of-sample verdict, not a claim about the pattern's textbook merit. Live win rates and R-multiples for the active picks are published on the performance page — we do not attach headline figures to retired or inconclusive setups.
Each strategy has a defined entry checklist, stop rule, and target -- explore the active set on the Strategies page. For more on the screening workflow, see How to Use the EasySwing Stock Screener. Ready to apply these strategies step by step? Follow the 7-step process for how to swing trade stocks. New to swing trading? Start with What is Swing Trading?. Scan results are for informational purposes only. See our Risk Disclaimer.
Frequently Asked Questions
What is the most profitable swing trading strategy?
There is no single answer, and EasySwing does not publish per-strategy headline win rates in blog copy — live tracked stats sit on the performance page. Textbook-famous patterns like Cup and Handle and RSI Reversion look attractive on paper, but in EasySwing's out-of-sample testing several of them did not clear the selection-edge bar and are retired from the active picks. Profitability depends on trading an active, regime-appropriate setup with disciplined risk, not on chasing a headline number.
How many swing trading strategies should I use?
Start with one or two strategies that match your typical market conditions and risk tolerance. Most active swing traders use 2-3 strategies: one momentum setup for bull markets, one mean reversion setup for all conditions, and optionally one short strategy for bear markets. Mastering one strategy deeply beats spreading yourself across seven.
Do swing trading strategies work in bear markets?
Long-only momentum strategies like VCP Breakout and Cup and Handle perform poorly in bear markets — breakouts fail when the broad market is declining. Short-side setups like Bear Flag and RSI Overbought are designed for downtrending and high-volatility regimes, though in EasySwing's out-of-sample testing those two did not clear the edge bar and are retired from the active picks. Adapting your strategy to the current market regime is essential, and many professional swing traders simply move to cash in bear regimes.
What is the difference between swing trading and day trading strategies?
Swing trading strategies hold positions for 2-30 days, use daily charts for analysis, and require 30-60 minutes per day. Day trading strategies close all positions by market close, use intraday charts (1-min to 15-min), and require full-time screen monitoring. Swing trading suits people with jobs; day trading is a full-time commitment. See our detailed comparison in [Swing Trading vs Day Trading](/blog/swing-trading-vs-day-trading).
How do I know which swing trading strategy to use right now?
The most important factor is the current market regime. In a bull market, momentum and pullback strategies dominate. In choppy or ranging markets, mean-reversion and range concepts are the textbook fit — though note that several of those (RSI Reversion, Swing Condor) are retired from EasySwing's active picks. EasySwing.trading detects the market regime automatically and surfaces the active strategies that match current conditions on the Strategies page.
Disclaimer: This article is for educational purposes only and does not constitute investment advice. EasySwing is a stock screening tool, not a registered investment advisor. All trading involves risk. Read our full disclaimer →