Bull Flag Pattern: How to Trade This High-Probability Breakout Setup
Thomas Bulkowski catalogued over 1,000 bull flag examples in Encyclopedia of Chart Patterns (3rd ed., 2021) and found that the pattern met its measured price target 66% of the time in uptrending markets, with an average advance of 14% within three weeks of the breakout. Few continuation patterns match that reliability combined with the tight risk definition the structure provides.
The bull flag is one of the most searched setups in technical analysis — and one of the most misapplied. This guide covers the complete pattern: anatomy, the nine-condition entry checklist, stop placement, profit targets, and which market regimes produce the statistical edge.
The Bull Flag Pattern Defined
A bull flag is a bullish continuation pattern — a sharp advance (the "pole") followed by a tight downward consolidation (the "flag"), then a breakout that resumes the advance. The pattern signals that sellers during the pause lacked conviction: when buying returns, the stock typically continues its prior move.
The pattern is meaningful because of what it reveals about supply and demand. After a sharp advance, early buyers take partial profits and short-term traders test the move. If the stock holds without giving back much ground — and volume contracts during the consolidation — selling pressure is light. When institutional buying returns, the stock clears the flag and typically extends the advance by a measured amount equal to the original pole height.
The Three Components of a Bull Flag
A bull flag consists of three sequenced phases: a high-volume advance (the pole), a declining-volume downward channel (the flag), and a breakout above the channel on expanding volume. Each phase has specific measurable criteria — missing any one reduces the pattern's statistical reliability significantly.
- The pole: A sharp, high-volume advance of 10% or more over 3-10 days. The steeper and faster the pole, the more meaningful the setup. A slow, grinding advance does not create the supply and demand imbalance that a bull flag resolves.
- The flag: A tight, downward-drifting channel lasting 3-15 trading days. Volume contracts during this phase as selling pressure eases. The flag should retrace no more than 38-50% of the pole — larger retracements signal that buyers are not in control.
- The breakout: Price closes above the upper trendline of the flag channel on above-average volume. This confirms that buyers have re-engaged and the advance is likely to continue.
Bulkowski's research shows a clear inverse relationship between flag depth and success rate: flags retracing under 38% of the pole had a 71% success rate versus 54% for flags retracing 50-62%. Keep the flag shallow.
Confirming the Uptrend: The EMA Stack
A bull flag is only valid when the underlying stock is in a confirmed Stage 2 uptrend. The EMA9 > EMA20 > SMA50 stack is the prerequisite — a stock with EMA9 below EMA20 is not in an uptrend, and any downward channel on its chart is not a bull flag.
EMA9 > EMA20 > SMA50This is the Stage 2 moving average structure. In a bull flag, the 9-day exponential moving average leads the advance, with the 20-day and 50-day trailing behind. During the flag phase, price typically dips toward — but not through — the EMA9/EMA20 support zone. When price bounces off the EMA zone and breaks above the flag's upper channel line, the entry is at its highest-probability point.
The EMA stack is an objective filter. A stock with EMA9 below EMA20 is not in a confirmed uptrend, and any downward channel on its chart is not a bull flag — it is a declining channel in a declining stock. Do not force the pattern where the structure is absent.
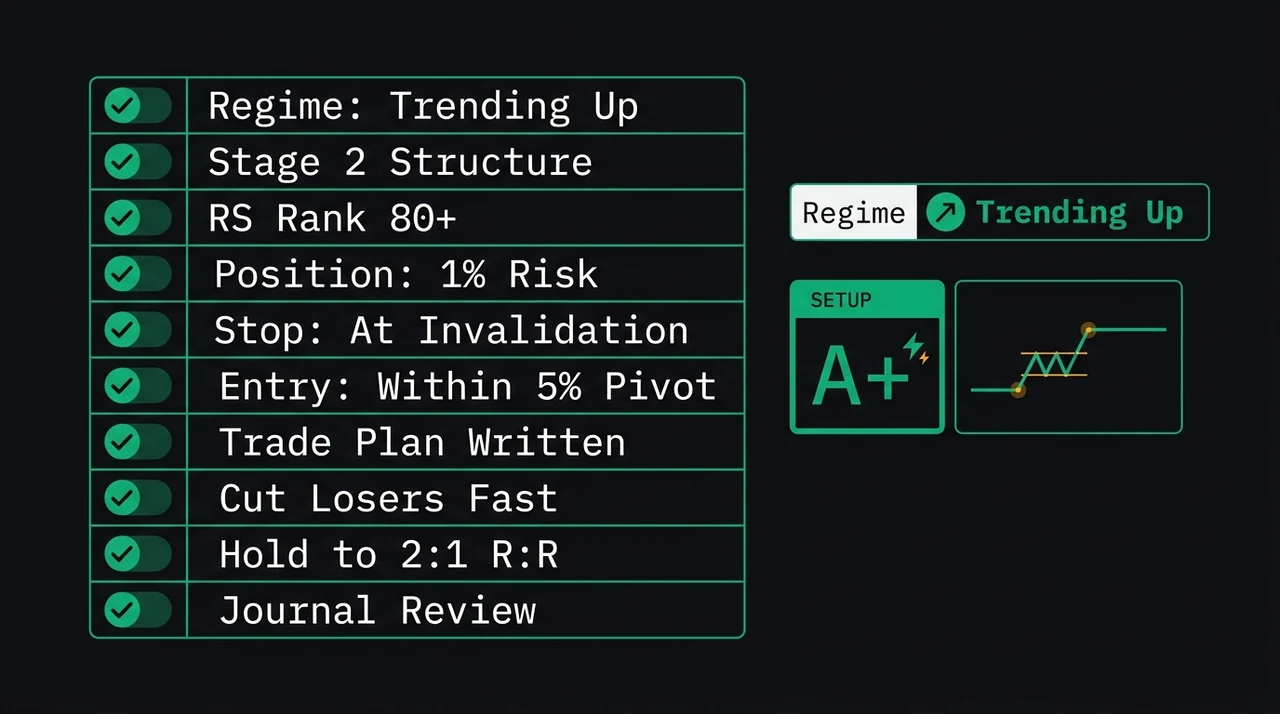
Bull Flag Entry Checklist
A bull flag entry requires confirming three categories simultaneously: pattern structure (pole height, flag depth, channel direction), quality filters (RS rank above 80, proximity to highs), and timing triggers (breakout on 1.5× or more above-average volume). Missing any category reduces the setup from high-probability to a coin flip.
Apply the following checklist before every entry:
- ✅ Prior advance (pole) of at least 10%, completed in 3-10 trading days
- ✅ EMA9 > EMA20 > SMA50 stack confirmed on the daily chart
- ✅ Flag channel sloping downward — not flat and not upward (those are different patterns)
- ✅ Flag retraces 25-50% of the pole, not more
- ✅ Volume contracts during the flag phase; no high-volume down-days
- ✅ RS rank at 80 or above — buy the strongest stocks, not the weakest
- ✅ Breakout candle closes above the upper flag channel trendline
- ✅ Breakout volume is 1.5× or more above the 50-day average
- ❌ Do not enter if the flag retraces more than 50% of the pole — the advance was too weak
- ❌ Do not enter if volume expands on down-days during the flag — sellers are still active
- ❌ Do not enter if the market regime is Ranging or Trending Down — bull flags fail when the macro trend works against you
The RS rank filter matters. William O'Neil documented in How to Make Money in Stocks (2009) that the best institutional breakout stocks consistently showed RS rank above 80 before their major advances. Buying bull flags in sub-70 RS stocks means buying relative weakness — you are picking the slowest runner in the race.
Stop Placement and Profit Targets
The bull flag's structure mathematically defines both the stop and profit targets before entry. Stop below the flag's lowest point or 1.5 ATR below entry — whichever is tighter. First target adds the pole's full height to the breakout price. These levels are set before entering, not adjusted based on market movement.
Here is how the levels work in practice:
- Stop loss: Below the flag's lowest close, or 1.5 ATR below entry — use whichever is closer. The flag low is the pattern's invalidation level. If price returns there, the breakout has failed.
- Target 1 (T1): Add the pole's full height to the breakout price — the measured move. Scale out 50% of the position at T1.
- Target 2 (T2): 2.5 ATR above entry. Trail the remaining position below the most recent swing low to capture the full continuation move.
- Maximum hold: 15 trading days. If T1 is not reached within that window, the momentum has faded — close the trade and redeploy capital.
Bulkowski's average gain of 14% after successful bull flag breakouts, combined with a 1.5 ATR stop, produces an expected 1.5-2.0R per winning trade. That is the expectancy required to remain profitable over time with a 66% win rate. For a full treatment of how stop placement and position sizing interact, see the position sizing guide.
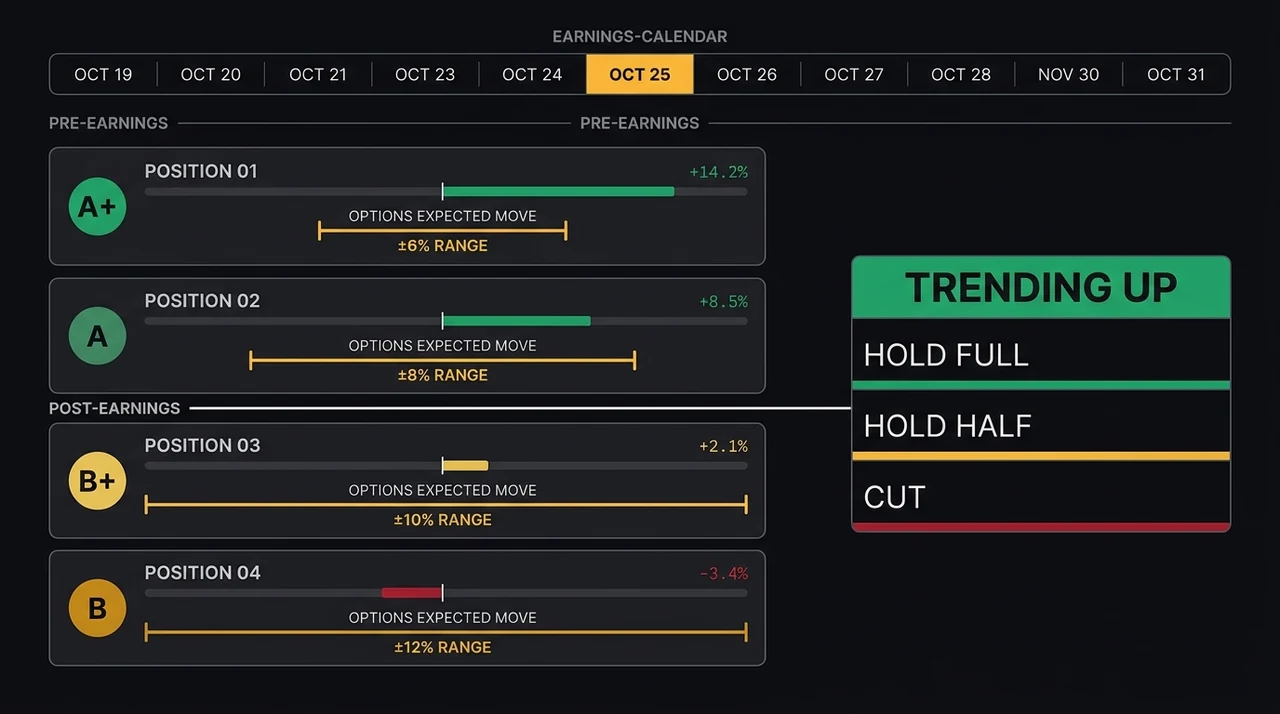
When Bull Flags Perform Best
Market regime determines whether bull flags succeed or fail. In uptrending markets, the 66-72% win rate makes the pattern one of the most reliable short-term breakout setups. That rate collapses below 35% in downtrending conditions — the macro environment overrides individual stock patterns regardless of setup quality.
| Regime | Expected Win Rate | Recommendation |
|---|---|---|
| Trending Up | 66-72% | Primary environment — all bull flags valid |
| Ranging | 40-48% | Only the tightest flags from the strongest RS names |
| Transitioning | 38-45% | Reduce position size; require volume confirmation |
| High Volatility | 35-42% | Wide stops required; very selective on quality |
| Trending Down | Below 35% | Avoid — individual breakouts fail into macro selling |
Mark Minervini describes the regime dependency in Trade Like a Stock Market Wizard (2013): "When the general market is in a confirmed downtrend, even the best stock setups will fail. The market is like a tide — it carries most stocks with it." Always check the macro regime before acting on any bull flag — no individual setup overrides a Trending Down market.
How EasySwing Identifies Bull Flag Structures
EasySwing surfaces bull flag-type structures through two strategies: VCP Breakout captures multi-contraction flags, and Trend Pullback captures single-phase dips into the rising EMA zone. Both require the Stage 2 EMA stack, declining volume during the consolidation, and an expanding-volume breakout — the same conditions that define a textbook bull flag.
[VCP Breakout](/blog/vcp-setup-volatility-contraction-pattern) catches bull flags where the flag has multiple tightening contractions. A stock that advances sharply, then forms three progressively tighter consolidation swings before the breakout, satisfies VCP detection criteria — which is technically a multi-contraction bull flag. The VCP is the institutional version of the pattern.
[Trend Pullback](/blog/pullback-to-rising-ma-trend-entry) catches bull flags where the flag pulls back cleanly to the EMA9/EMA20 zone. A stock that advances sharply, then drifts to the rising EMA band on declining volume, and resumes with a bounce candle matches the Trend Pullback entry conditions — the single-phase bull flag in its purest form.
When EasySwing returns a VCP or Trend Pullback setup with a recent strong advance, high RS rank, and contracted volume, you are typically looking at a bull flag structure, graded A+/A/B+/B/C by the scanner's conviction score. Higher grades reflect tighter flags, stronger RS, and cleaner volume signatures. Run a scan at strategies to see live setups.
Common Bull Flag Trading Mistakes
The four most costly bull flag errors are chasing the pole advance, accepting a deep flag, entering on a low-volume breakout, and holding through a macro regime shift. Each error is avoidable by reading the full entry checklist before entering the trade, not after the position is open.
Chasing the pole. The pole advance is already completed when you identify the pattern. Buying after the sharp rise — hoping to participate in more of the original move — puts you in at exhaustion, not at a low-risk point. Wait for the flag to form and buy the breakout, not the original advance.
Accepting a deep flag. A flag that retraces 60% or more of the pole is not a bull flag — it is either a failed breakout or a new base forming. Bulkowski's data show a clear inverse relationship: flags under 38% deep had a 71% success rate versus 54% for 50-62% deep flags. Depth kills the edge.
Buying low-volume breakouts. A breakout above the flag channel on below-average volume frequently fails within 1-3 days. Without institutional participation, there is no sustained buying pressure. Require at least 1.5× average volume on the breakout candle before entering — 2× or more is better.
Holding through regime changes. A bull flag that triggers as the market shifts to High Volatility or Trending Down has lost its tailwind. Exit quickly. Macro regime changes override individual stock setups, and Grade A entries fail as readily as Grade C ones when the broad market is declining.
Key Takeaways
- A bull flag is a two-phase continuation pattern: sharp advance (pole) + brief downward consolidation (flag) + breakout above the channel on expanding volume
- The EMA9 > EMA20 > SMA50 stack is a prerequisite — if the stack is absent, the pattern is not a bull flag
- Entry requires the flag to retrace no more than 50% of the pole, with volume contracting during the flag phase
- Stop goes below the flag low or 1.5 ATR below entry; T1 is the pole height added to the breakout price; max hold is 15 days
- Performance is regime-dependent: 66-72% win rate in Trending Up markets, below 35% in downtrends
- EasySwing surfaces bull flag structures via its VCP Breakout and Trend Pullback strategies — look for Grade A/B setups with RS rank above 80 and a strong recent pole advance
Frequently Asked Questions
How is a bull flag different from a VCP?
Both are bullish continuation patterns that require declining volume during the consolidation and expanding volume on the breakout. The difference is the number of contraction phases. A bull flag has a single downward channel — one clean drift lower. A VCP has three or more progressively tighter contractions. A VCP is technically a bull flag with multiple nested contractions. Both signal the same dynamic: sellers exhausted, institutional buyers returning.
How long should a bull flag take to form?
Most reliable bull flags form in 3-15 trading days. Flags extending beyond three weeks tend to lose the momentum effect from the original pole — the original buyers' conviction fades and the breakout, if it comes, is less likely to produce the measured-move target. If the flag is still intact after four weeks, treat it as a new consolidation base rather than a flag continuation.
What volume should I see on the breakout?
A valid bull flag breakout shows volume at least 1.5× the 50-day average on the breakout day, with 2× preferred. Volume is the proof of institutional participation — without it, the breakout is retail-driven and typically fails within 1-3 days. A low-volume close above the flag high is a warning, not a buy signal.
Can a bull flag work in a ranging market?
With reduced probability, yes. In ranging conditions, the expected win rate drops to 40-48% versus 66-72% in uptrending markets. To trade bull flags in ranging regimes, apply tighter filters: only accept flags retracing under 38% of the pole, require RS rank above 85 (not just 80), and demand at least 2× average volume on the breakout. Smaller position size is appropriate given the lower base-rate success.
What is the difference between a bull flag and a pullback to the EMA?
A pullback to the EMA is a more gradual dip into a rising moving average — no sharp pole advance required. A bull flag specifically needs a steep, fast advance before the consolidation begins. In practice, the two patterns frequently overlap: when a bull flag's consolidation dips to the EMA9/EMA20 zone, both criteria are satisfied simultaneously — and that overlap produces some of the highest-probability entries in swing trading.
EasySwing.trading detects bull flag-type structures automatically through its VCP Breakout and Trend Pullback strategies, grading each setup on a five-tier A+/A/B+/B/C scale based on pattern quality, RS rank, and volume signature. See related guides on the bear flag short setup and swing trading strategies. Scan results are for informational purposes only. See our Risk Disclaimer.
Disclaimer: This article is for educational purposes only and does not constitute investment advice. EasySwing is a stock screening tool, not a registered investment advisor. All trading involves risk. Read our full disclaimer →