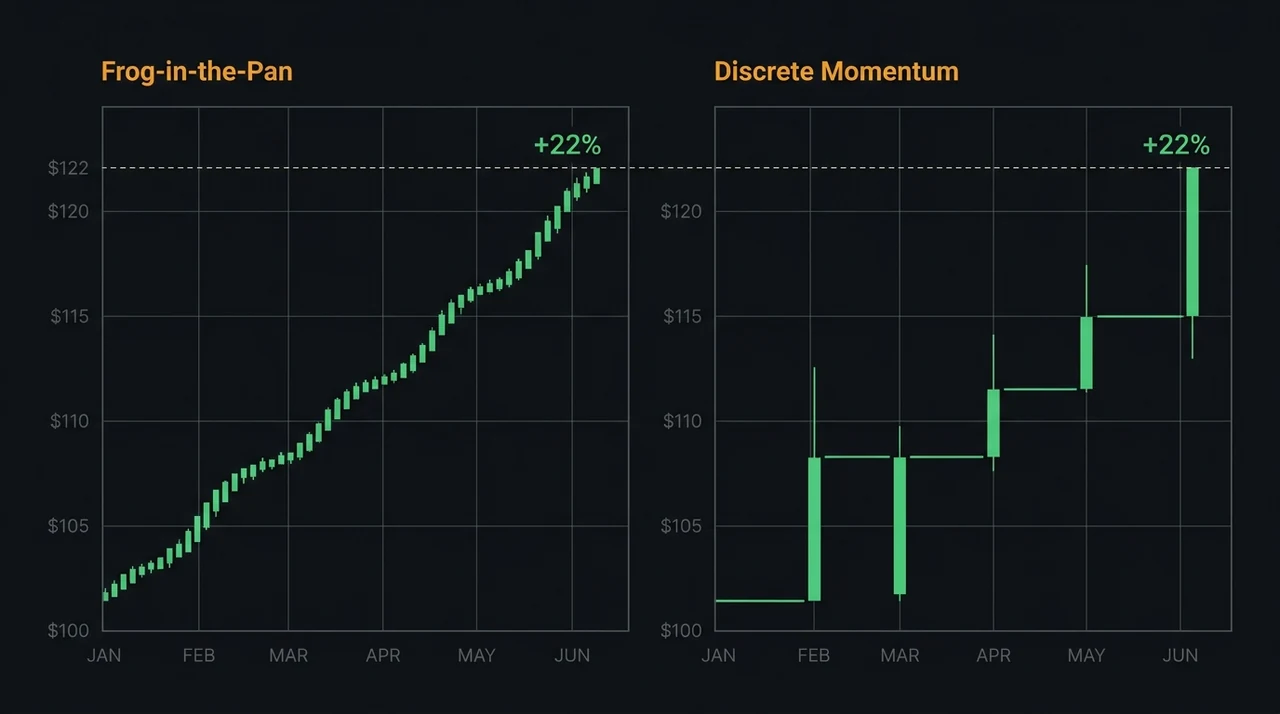
Frog-in-the-Pan Momentum: Smooth Price Path Signals
Da, Gurun & Warachka (2014, Review of Financial Studies) studied nearly eight decades of US equity returns (1927–2007) and found that stocks whose six-month gain arrived via many small daily increments outperformed stocks with the same cumulative return delivered via a few large jumps — generating abnormal returns that persisted across bull markets, bear markets, and multiple decades of out-of-sample data.
The mechanism is investor attention. When a stock gains 20% through five high-volume surge days, financial media covers it, retail alerts fire, and speculative buyers pile in after the information has already been priced. When the same 20% arrives quietly across 60+ small daily advances, institutional accumulation builds under the surface while retail attention stays elsewhere. The smart money accumulates a full position before the crowd arrives. Supply overhang is minimal. When the stock finally breaks to new highs, it has fewer informed sellers waiting to exit.
Short answer: The Frog-in-the-Pan pattern identifies momentum stocks whose six-month return came via continuous, gradual price increments rather than discrete large-day spikes. Da, Gurun & Warachka named it after the folk parable — gradual change goes unnoticed until it's complete. EasySwing built a screen around this academic finding, gated on RS rank ≥ 95 and A/A+ grade.
Honest status note: in EasySwing's current out-of-sample verdict, this implementation did not clear our selection-edge bar. It is retired from the active picks — part of our strategy graveyard, not the live scanner. The academic anomaly below is real and worth understanding; what did not hold up is our specific screenable implementation of it under permutation testing. We do not attach a live win rate or profit factor to a retired setup. Live, tracked stats for the strategies that did clear the bar are on the performance page.
What Is the Frog-in-the-Pan Pattern
The Frog-in-the-Pan (FIP) pattern is a momentum anomaly first documented by Da, Gurun & Warachka in the 2014 Review of Financial Studies. A stock qualifies as a FIP setup when its trailing six-month return is strong (≥+15%) AND that return arrived via continuous daily increments — more up-days than down-days during the window, meaning the price moved in a gradual staircase rather than through a handful of explosive sessions. This "continuous momentum" configuration predicts higher subsequent returns than standard momentum of equivalent magnitude.
The "boiling frog" metaphor anchors the name. A frog dropped in hot water jumps out immediately — the discrete, visible shock triggers an immediate reaction. A frog placed in gradually heating water stays until it's too late — the continuous, slow change never crosses the attention threshold. The same dynamic governs institutional accumulation. A stock that gaps up 8% on earnings coverage attracts retail traders who buy the news, creating supply overhang from latecomers with a high average cost basis. A stock that climbs $28 over 90 sessions through small daily advances never triggers the attention response, so it builds its position clean — without a crowd of reactive buyers waiting to sell into the next uptick.
Da, Gurun & Warachka validated this effect on US equity returns from 1927 through 2007, with a post-1980 subperiod confirming it held across later decades. The FIP premium was strongest among high-momentum stocks already ranked in the top 20–30% of their cross-sectional cohort. The anomaly survives risk-adjustment for size, value, and standard price momentum — meaning it captures something distinct from the classic Jegadeesh-Titman (1993, Journal of Finance) momentum factor, whose zero-cost portfolio — buying past winners and selling past losers — earned a 12.01% annualized excess return.
The Information Discreteness Signal
Information Discreteness (ID) is the core calculation behind the FIP pattern. For any stock over a trailing 126-session (six-month) window, ID measures the proportion of negative-return days minus the proportion of positive-return days. When a stock's cumulative return arrived via fewer positive days than negative days — meaning each positive day was outsized relative to the many small red days — ID is positive. When the return arrived via more modest positive days than negative days, ID is negative (below zero).
ID ≤ 0 is the FIP filter condition. A stock with ID at or below zero logged more up-days than down-days during its six-month advance — the gain accrued through many small positive sessions rather than a few large jumps. This is the institutional accumulation signature: buyers absorbing seller flow day by day, moving the stock higher through patient accumulation rather than a single identifiable catalyst.
Compare this to a stock with ID above zero: the same six-month return delivered via 3–5 large single-day gains and many flat or down sessions. Those 3–5 sessions were visible, covered by financial media, and attracted reactive buyers who entered at elevated prices. Those reactive buyers — with cost basis near the top of the move — become overhead resistance the next time the stock approaches those levels. The supply overhang from a lumpy momentum stock is structurally higher than from a continuous momentum stock.
The practical consequence: when a FIP stock breaks to new 52-week highs, there are fewer trapped buyers waiting to exit into strength. The breakout travels further before encountering meaningful resistance.
The Five Entry Conditions EasySwing Checks
EasySwing's Frog-in-the-Pan Momentum strategy applies five conditions simultaneously at market close. All five must be true for the setup to score BUY or WATCH.
EasySwing scans 2,000+ US equities daily for all five conditions at market close, assigning a grade and pre-calculated entry, stop, and target to every qualifying setup.
- Moving average stack intact: Close > SMA50 > SMA200. The stock must occupy a confirmed long-term uptrend. Any setup failing this condition — regardless of momentum characteristics — is eliminated before the FIP screen runs.
- Six-month return ≥ +15%: Trailing 126-session return at or above 15%. This floor captures genuine momentum leaders while staying clear of the "already extended" zone where entry risk overwhelms the theoretical edge.
- Information Discreteness ≤ 0: More up-days than down-days in the six-month window. This is the core FIP condition. Stocks satisfying this criterion have their gains distributed across many sessions — the institutional accumulation pattern Da, Gurun & Warachka identified as the durable portion of the momentum premium.
- Within 6% of the 20-day high: Current price is approaching its recent high, not already extended past it. Entry within this proximity band places the setup at the re-entry inflection point where buying pressure resurfaces after a brief consolidation.
- RS rank ≥ 95 (extreme-leaders tier): EasySwing's autoresearch sweep concentrated the FIP screen among the top 5% of US equities by trailing 12-month relative performance — the "extreme-leaders" region where institutional conviction is highest. This is stricter than the strategy's baseline minimum.
Two additional gates apply: the setup must receive an A or A+ composite grade on EasySwing's pattern-quality scoring system, and the market regime must be TRENDING_UP or RANGING. Below those conditions, the strategy goes dormant.
Why Frog-in-the-Pan Is in EasySwing's Graveyard
EasySwing runs every candidate strategy through an out-of-sample permutation sweep: a training window establishes the parameter set, then a separate holdout window measures genuine out-of-sample performance, and a permutation test checks whether the result could have come from chance. A strategy only earns a spot in the live picks if it clears that selection-edge bar.
Frog-in-the-Pan did not clear it in our current verdict. Momentum-continuation setups like this one earn through asymmetry — a minority of winners that travel far outweigh a majority of small losers — but that same low-win-rate profile makes the edge fragile and hard to distinguish from noise once you account for multiple-testing and realistic costs. When the permutation test could not separate this implementation's holdout result from the random baseline at our confidence bar, we retired it rather than surface a marginal signal as a live pick.
That is the whole point of the framework: we would rather move a plausible, academically grounded setup to the graveyard than keep it in the scanner on an edge we cannot verify out-of-sample. We do not publish a win rate or profit factor for a retired setup. For the strategies that are live-tracked, see the performance page.
Trade Structure: Entry, Stop, and Exit
EasySwing's Frog-in-the-Pan Momentum trades use a three-level structure calibrated to the strategy's tuned parameters.
Entry: When all five conditions align and grade is A or A+, enter on the close of the BUY signal session or with a limit order at the trigger level shown in the scanner. The trigger requires a bounce above the prior session's high within 6% of the 20-day high.
Stop: Placed at 1.37× ATR14 below the entry close. This width absorbs the intraday noise typical of high-RS accumulation patterns without leaving excessive capital at risk per trade. Apply the 1% rule: position size so the stop loss equals ≤ 1% of total account equity.
Targets: Scale out 50% at T1 (2.66× ATR14 above entry) and the remaining 50% at T2 (4.99× ATR14). This structure creates a 1.9:1 risk/reward at T1 and 3.6:1 at T2. Most closed trades settle near T1 — the T2 target captures the minority of setups that extend into a sustained multi-week trend.
Trailing stop: After T1 is reached, the remaining half-position trails 1.5× ATR14. If the stock fails to reach T2 within 19 sessions — the tuned maximum hold — it exits on the time stop regardless of price. A time stop of 19 sessions prevents capital from being locked in stalled setups while the screener surfaces fresher opportunities.
Regime invalidation: If the market regime shifts to TRENDING_DOWN or HIGH_VOLATILITY while a FIP position is open, tighten the trailing stop to 1× ATR14 and reduce target expectations. The institutional demand flow that drives gradual accumulation weakens materially in bear regimes.
How Frog-in-the-Pan Fits the Momentum Framework
Standard price momentum — buying all top-quintile six-month return stocks — was the original Jegadeesh-Titman finding. It works because strong recent performance tends to persist over the following 3–12 months. Frog-in-the-Pan is a refined subset of that universe: among all strong-momentum stocks, favor the ones whose gains arrived smoothly.
This relationship matters for how to think about the strategy. Every FIP setup is also a momentum setup. Not every momentum setup is a FIP. The FIP filter adds one condition on top of standard momentum — the path by which the return arrived — and that single addition has historically separated the more durable portion of momentum returns from the reactive, media-driven version.
| Attribute | Standard Momentum | Frog-in-the-Pan |
|---|---|---|
| Base criterion | Top-quintile 6-month return | Same |
| Path filter | None | ID ≤ 0 (continuous, smooth) |
| Retail attention | Varies | Low during accumulation |
| Supply overhang | Moderate | Lower at breakout |
| EasySwing RS gate | Varies by strategy | RS ≥ 95 (extreme-leaders) |
| Max hold (tuned) | Varies | 19 days |
EasySwing's Momentum Breakout strategy targets the broader standard momentum universe — strong RS leaders at pattern breakout points. The Frog-in-the-Pan adds the path screen specifically for the continuous-accumulation subset that the 2014 research identified as generating higher-quality continuation signals.
If the Minervini Trend Template Fresh-Pass catches the moment a stock re-enters the institutional leadership cohort after a correction, and the Pullback to Rising MA targets re-entries from moving-average support, Frog-in-the-Pan Momentum enters during the active accumulation phase itself — while the continuous price path is ongoing, the 52-week high is approaching, and the crowd has not yet arrived.
Frog-in-the-Pan Setup Checklist
Use this checklist before entering any Frog-in-the-Pan Momentum setup:
- ✅Moving average stack intact — Close > SMA50 > SMA200
- ✅Six-month return ≥ +15%
- ✅Information Discreteness ≤ 0 (more up-days than down-days in the 6-month window)
- ✅Current price within 6% of the 20-day high
- ✅RS rank ≥ 95 (extreme-leaders tier)
- ✅Grade A or A+ assigned by EasySwing's composite quality scoring
- ✅Market regime is TRENDING_UP or RANGING
- ✅Stop placed at 1.37× ATR14 below entry close
- ✅Position sized so stop loss ≤ 1% of total account equity
- ❌Stock recently gapped up on earnings or news — ID condition may pass numerically but the institutional-accumulation context is absent
- ❌Market regime is TRENDING_DOWN or HIGH_VOLATILITY — the FIP edge requires accommodating macro conditions
- ❌Stock is more than 12% extended above the 20-day high — entry timing has passed
- ❌Volume has been below average for 5+ consecutive sessions — accumulation has paused
Frequently Asked Questions
What is the Frog-in-the-Pan pattern in trading?
The Frog-in-the-Pan pattern identifies stocks whose six-month cumulative return arrived via many small daily gains rather than a few large single-day jumps. Da, Gurun & Warachka (2014, Review of Financial Studies) found this continuous momentum signature generates higher subsequent returns because gradual institutional accumulation avoids the retail attention and supply overhang that accompany visible large-day moves.
What is Information Discreteness in the Frog-in-the-Pan strategy?
Information Discreteness (ID) is the proportion of negative-return days minus positive-return days over the prior 126 trading sessions (six months). A negative ID value — more up-days than down-days — indicates the stock's cumulative return arrived via many small positive increments rather than a few large spikes. EasySwing calculates ID daily for every tracked stock using closing prices, then flags stocks with ID ≤ 0 as FIP candidates when the other four entry conditions are also met.
What win rate should I expect from the Frog-in-the-Pan strategy?
EasySwing does not publish one. This implementation did not clear our out-of-sample selection-edge bar, so it is retired from the active picks and we will not attach a live win rate or expectancy to it. In general, momentum-continuation setups win on fewer than half their trades and earn through asymmetric payoffs — winners far larger than losers — but that low-win-rate profile is exactly what makes an edge hard to verify, which is why this one is in the graveyard. For live-tracked stats, see the performance page.
Which market regimes support the Frog-in-the-Pan strategy?
The strategy runs in TRENDING_UP and RANGING regimes. In TRENDING_DOWN or HIGH_VOLATILITY environments, FIP setups go dormant — the institutional demand flow that drives gradual accumulation requires a supportive macro backdrop to sustain into continuation. Before entering any FIP setup, confirm the current regime is TRENDING_UP or RANGING at /strategies.
How does Frog-in-the-Pan differ from VCP and Pullback to Rising MA strategies?
A VCP identifies the volatility-contraction consolidation just before a breakout; the Pullback to Rising MA enters at a support re-test after a dip. Frog-in-the-Pan enters earlier in the accumulation cycle — while the smooth continuous path is still developing and the stock approaches its recent high from below, before a defined breakout trigger exists. All three strategies operate in similar regimes and require the moving average stack; they differ in the specific price structure that defines entry timing.
Frog-in-the-Pan Momentum is retired from EasySwing's active picks — it did not clear our out-of-sample selection-edge bar, and this guide covers the mechanism as education rather than a live signal. For the broader momentum framework this pattern sits within, see Momentum Trading: How to Find Breakout Stocks and the full swing trading strategies guide. Scan results are for informational purposes only. See our Risk Disclaimer.
Disclaimer: This article is for educational purposes only and does not constitute investment advice. EasySwing is a stock screening tool, not a registered investment advisor. All trading involves risk. Read our full disclaimer →