Swing Trading Examples: 5 Real Setups With Entries, Stops, and Targets
William O'Neil's study of every major winning stock from 1953 to 1985 -- documented in How to Make Money in Stocks (4th ed., 2009) -- found the same set of chart patterns recurring in 95% of big winners before their main advance. Swing trading examples are how you build the pattern recognition to spot those setups on a live chart before they trigger -- not after the move is over.
This guide walks through five concrete examples across five strategies: a bull flag, a VCP breakout, an RSI mean reversion bounce, a trend pullback to a moving average, and a bear flag short. Each example includes the screening criteria that flagged it, the entry price, the stop-loss placement, the profit target, and how the trade resolved.
What a Good Swing Trading Example Teaches You
A useful swing trading example maps setup detection criteria to specific price action, shows the risk-defined entry parameters, and traces how the trade resolved against the original plan. The value is pattern recognition that transfers to the next setup -- not a set of past trades to copy.
Each example below follows a consistent structure: how the screener detected it, the key criteria, an entry/stop/target table, and the outcome. This matches how EasySwing presents live setups, so studying these examples directly trains your eye for real scans.
Example 1: Bull Flag Continuation
A bull flag is a momentum continuation setup where a sharp advance (the pole) is followed by a tight, orderly pullback on declining volume (the flag). Thomas Bulkowski's analysis in Encyclopedia of Chart Patterns (3rd ed., 2021) found that bull flags forming in confirmed uptrends have a 67% upward breakout rate -- one of the highest among short-duration continuation patterns.
The scenario: A mid-cap technology company ($3.8B market cap) surges 31% over 19 trading days, then pauses for 8 sessions in a tight channel, retracing 7.2% on volume that runs 39% below the 50-day average. On day 9, the stock gaps up at the open.
How EasySwing flagged it:
- RS rank: 91 (top decile of the 2,000-stock universe)
- Price above SMA20, SMA50, and SMA200
- Flag channel depth under 10%
- Volume on consolidation: 39% below 50-day average (drying up)
Trade parameters:
| Parameter | Value |
|---|---|
| Entry (flag breakout) | $47.20 |
| Stop (below flag low) | $43.80 |
| Target 1 (1.5× pole) | $55.20 |
| Target 2 (2.0× pole) | $60.80 |
| Risk per share | $3.40 |
| R-multiple at T1 | 2.4R |
Outcome: The stock cleared the flag on breakout day volume 2.6× the 50-day average. Target 1 was hit in 7 sessions. The remaining position was sold at breakeven when price stalled below Target 2.
Full bull flag entry and management rules: Swing Trading Strategies guide.
Example 2: VCP Breakout (Volatility Contraction Pattern)
The Volatility Contraction Pattern (VCP), developed by Mark Minervini, identifies stocks where each successive pullback inside a base gets smaller in both depth and volume -- signalling institutional accumulation and seller exhaustion. Minervini writes in Trade Like a Stock Market Wizard (2013): "The VCP is the footprint of institutional buying. Each contraction is quieter because supply is being absorbed." His research found over 70% of his winning trades from 1997 to 2007 showed a VCP structure before the breakout.
The scenario: A healthcare company in a Stage 2 uptrend builds a 13-week base. Three contractions form: the first pullback retraces 19%, the second 11%, the third 5.8%. Volume decreases on each down-leg. The stock sits 2.9% below its 52-week high at the time of detection.
How EasySwing flagged it:
- Contraction sequence: T1 = 19%, T2 = 11%, T3 = 5.8% (each within 60% of the prior contraction) ✓
- Volume declining on each down-leg ✓
- Stage 2 confirmed (price above 50/150/200-day MA stack) ✓
- RS rank: 88 ✓
- Within 5% of pivot high ✓
Trade parameters:
| Parameter | Value |
|---|---|
| Entry (pivot breakout) | $82.40 |
| Stop (below T3 low) | $77.20 |
| Target 1 (measured move) | $94.20 |
| Target 2 (extended move) | $103.00 |
| Risk per share | $5.20 |
| R-multiple at T1 | 2.3R |
Outcome: The stock broke out on 2.2× average volume. Target 1 was hit in 11 sessions. Target 2 was reached 3 weeks later during a sector rotation into healthcare. Full pattern rules and entry checklist: VCP Setup Guide.
Example 3: RSI Mean Reversion Bounce
Mean reversion setups buy temporarily oversold stocks within confirmed uptrends -- the idea being that sharp dips in strong trends are re-entry opportunities, not reversals. Larry Connors, in Short-Term Trading Strategies That Work (2008), documented that buying S&P 500 members when the 2-day RSI dropped below 10 (with price above the 200-day MA) produced a 3-day average return of 2.1% versus 0.3% for random entries across a 12-year backtest.
The scenario: A large-cap consumer discretionary stock has been in a Stage 2 uptrend for 11 months. Over 6 trading days it drops 8.7% on no material news -- RSI(14) falls to 28.3, RSI(2) reaches 4.1. The broader market is in a "Ranging" regime. EasySwing flags it as an RSI Reversion Oversold setup.
How EasySwing flagged it:
- RSI(14) below 30 on daily chart ✓
- Price still above 200-day MA ✓
- ADX(14) above 20 (trend confirmed, not in free-fall) ✓
- Volume on the down-move declining (healthy pullback, not distribution) ✓
- RS rank: 79 (solid, not collapsing) ✓
Trade parameters:
| Parameter | Value |
|---|---|
| Entry (next-day open) | $134.50 |
| Stop (below recent swing low) | $128.60 |
| Target 1 (SMA20 reclaim) | $141.30 |
| Risk per share | $5.90 |
| R-multiple at T1 | 1.2R |
Outcome: The stock bounced from the swing low the next morning, reclaimed the SMA20 in 4 sessions. The R-multiple is tighter than breakout setups, but the higher win rate in ranging markets makes this the most regime-resilient strategy in the screener. Full methodology: RSI Mean Reversion Guide.
Example 4: Trend Pullback to Rising Moving Average
The trend pullback strategy buys trending stocks on temporary dips into the EMA9/EMA20 zone -- the area Kunal Desai calls the "Bone Zone." The logic: institutions use dips to the 9-day and 20-day EMA to add to winning positions, creating a self-reinforcing support zone that resolves upward once selling pressure exhausts. Jegadeesh and Titman (1993, Journal of Finance) documented that momentum strategies -- buying recent outperformers -- returned 12% annualized over 25 years. The trend pullback entry capitalises on the same momentum while reducing entry price by waiting for a temporary dip.
The scenario: A semiconductor stock in a Stage 2 uptrend pulls back 5.4% over 4 days on declining volume, touching the rising EMA20 on day 4. The broader market is in a "Trending Up" regime. No earnings report within 3 weeks.
How EasySwing flagged it:
- Price touched EMA20 (Bone Zone lower bound) ✓
- EMA9 > EMA20 > SMA50 > SMA200 (full MA stack intact) ✓
- Volume on 4-day pullback: 31% below 50-day average ✓
- No earnings within 15 days ✓
- RS rank: 86 ✓
Trade parameters:
| Parameter | Value |
|---|---|
| Entry (close above EMA9) | $176.30 |
| Stop (below EMA20) | $169.80 |
| Target (prior swing high) | $187.50 |
| Risk per share | $6.50 |
| R-multiple at target | 1.7R |
Outcome: The stock closed above EMA9 on day 5 of the pullback, hit the prior swing high in 9 sessions. This setup performs best in "Trending Up" and "Ranging" regimes. In "High Volatility" regimes, pullbacks commonly cut through the EMA zone entirely -- skip it when broad market conditions are extreme.
For the indicator context behind this setup: Best Indicators for Swing Trading.
Example 5: Bear Flag Short Setup
Swing trading works on the short side too. Note up front: the bear flag is retired from EasySwing's active screener — permutation testing did not confirm a selection edge, so it now lives in the strategy graveyard. This example is kept for the short-side mechanics, not as a current pick. During "Trending Down" market regimes, bear flags are a classic continuation concept to the downside. Research by Osler and Chang (Journal of Finance, 2001) found that bearish continuation patterns in stocks with declining relative strength outperformed random short entries by 1.9% over 5-day holding periods across a 10-year dataset.
The scenario: A retail sector stock is in Stage 4 decline. Price falls 24% over 7 weeks (the pole), then consolidates for 9 days in a shallow rising channel -- the bear flag. Volume drops 44% below average during the flag (confirming it is a pause, not a reversal). The stock's RS rank is 11 (bottom decile). The market regime is "Trending Down."
How EasySwing flagged it:
- Price below SMA20, SMA50, and SMA200 ✓
- Bear flag channel: 9-day consolidation, 5.8% gain on declining volume ✓
- RS rank: 11 (bottom decile) ✓
- Market regime: Trending Down ✓
- Volume on flag: 44% below 50-day average ✓
Trade parameters:
| Parameter | Value |
|---|---|
| Entry (break below flag low) | $31.40 |
| Stop (above flag high) | $33.90 |
| Target 1 (measured move) | $24.80 |
| Risk per share | $2.50 |
| R-multiple at T1 | 2.6R |
Outcome: The stock broke down on day 10 of the flag on 1.9× average volume. Target 1 was reached in 8 sessions during continued sector weakness. Full short setup rules and checklist: Bear Flag Short Setup Guide.
How to Screen for These Setups Live
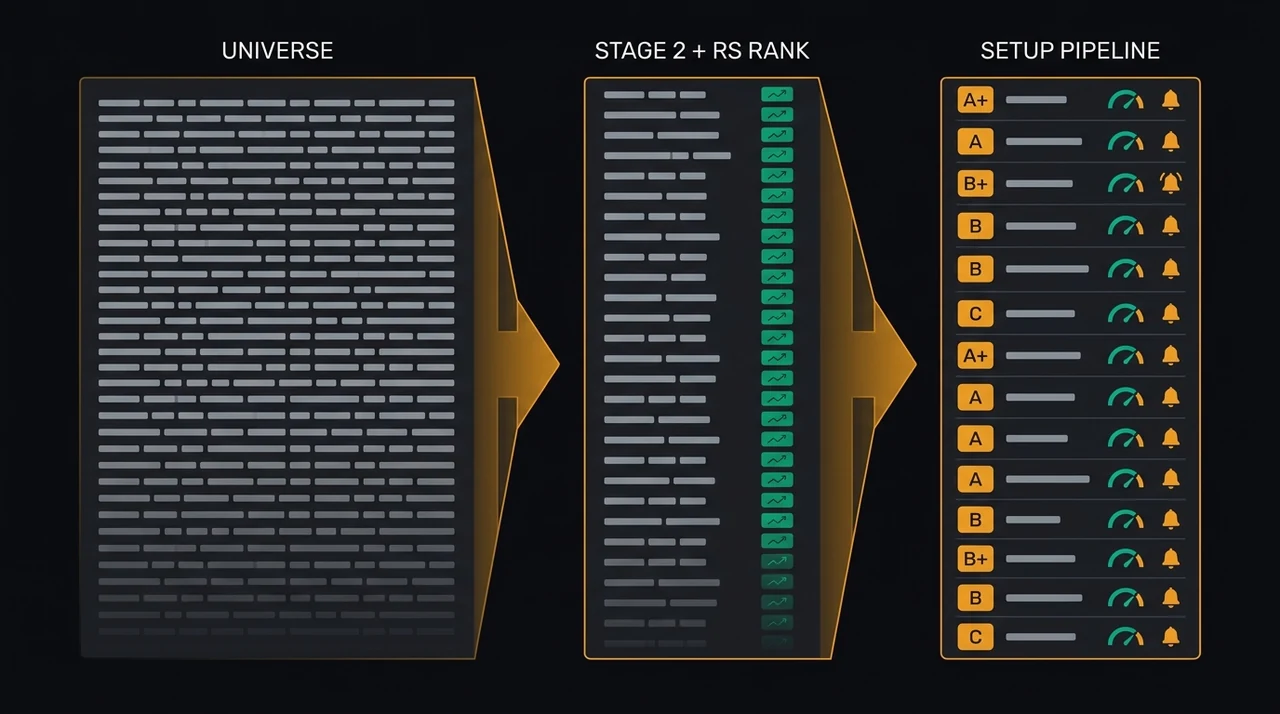
Studying examples builds pattern recognition. A daily screening workflow converts that recognition into a repeatable process. Here is the checklist EasySwing applies each evening to filter 2,000+ stocks down to the highest-probability candidates:
Long setup checklist:
- ✅ Stage 2 confirmed (price above SMA50 > SMA150 > SMA200, all rising)
- ✅ RS rank 80 or above (80+ for pullbacks; 90+ for breakouts)
- ✅ Volume pattern matches the setup type (drying up during base, expanding on breakout)
- ✅ Market regime is Trending Up or Ranging
- ✅ No earnings report within 2 weeks of planned entry
- ❌ Avoid stocks where the moving average stack is inverted (Stage 4)
- ❌ Avoid breakouts on below-average volume -- unconfirmed moves fail at a higher rate
Short setup checklist:
- ✅ Stage 4 confirmed (price below SMA50 < SMA150 < SMA200, all declining)
- ✅ RS rank below 30 (stocks in the bottom decile of the universe)
- ✅ Market regime is Trending Down or High Volatility
- ✅ Bear flag or descending channel pattern identified
- ❌ Avoid shorting stocks with RS rank above 50 -- too much relative strength to short profitably
- ❌ Skip short setups in Trending Up regimes -- the broad market lifts even weak stocks
To build this workflow using a live screener, see How to Use a Stock Screener for Swing Trading.
Frequently Asked Questions
What is a swing trading example? A swing trading example shows a specific setup -- entry price, stop-loss, and profit target -- using a defined strategy such as a bull flag, VCP, or RSI bounce. The example traces how the setup was detected, what the risk parameters looked like, and how the trade resolved against the original plan.
How many days does a typical swing trade last? Most swing trades last 3 to 30 days depending on the strategy. Momentum breakouts (VCP, bull flag, cup and handle) typically reach their first target in 7 to 16 days. RSI mean reversion setups resolve faster -- often 3 to 5 days. Trend pullbacks fall in the middle at 7 to 12 days.
What R-multiple should a swing trade target? Most high-probability setups should offer at least 1.5R to 2R on the first target -- meaning the potential profit is 1.5 to 2 times the initial risk. Momentum breakouts typically project 2R to 3R. Mean reversion setups offer 1R to 1.5R but at higher win rates. A trade with less than 1R potential is rarely worth the risk.
Can these examples be used as a screening checklist? Yes. The entry criteria in each example above can be applied directly as a scanning checklist. Before entering any setup, verify moving average alignment, RS rank, volume pattern, and distance from the pivot -- all conditions should pass before entry.
What is the difference between a swing trading example and a live signal? An example is retrospective or illustrative -- it shows what a setup looked like and how it resolved. A live signal notifies you in real time when a stock is entering setup conditions right now. EasySwing converts the patterns in these examples into configurable alerts that fire when a live stock matches your criteria.
EasySwing screens 2,000+ stocks automatically each evening for its active named setups — including VCP breakouts and trend pullbacks. (The bear flag and classic RSI mean-reversion examples above are kept for education; both are retired from the active screener — see the strategies hub for the current lineup.) For deeper reading on how to manage risk across these setups, see our Position Sizing guide and the complete Swing Trading Strategies guide. Scan results are for informational purposes only. See our Risk Disclaimer.
Disclaimer: This article is for educational purposes only and does not constitute investment advice. EasySwing is a stock screening tool, not a registered investment advisor. All trading involves risk. Read our full disclaimer →