EasySwing vs ChartMill: Which Screener Fits Swing Traders?
William O'Neil's analysis of the greatest stock market winners (How to Make Money in Stocks, 2009) found that fewer than 2% of stocks produce the majority of market gains in any given year. Identifying that 2% early — before the breakout, not after — separates a pattern detector from a swing trading tool.
ChartMill detects 59 chart patterns across US, Canadian, and European stocks. EasySwing.trading runs 13 named swing trading strategies across 2,000+ US stocks, scores each result by quality grade, and gates every alert through a market regime engine. Both serve technical traders; they approach the workflow differently.
What ChartMill and EasySwing.trading Are
ChartMill is a stock screener scanning US, Canadian, and European markets for 59 chart patterns with 180+ filter parameters and a 0–10 formation quality score. EasySwing.trading is a purpose-built US swing trading scanner running 13 named strategy setups, grading each result on a 100-point composite scale, and gating every alert through a five-state market regime engine.
ChartMill launched in 2008, built by a team of traders in Belgium. It covers US, Canadian, and European exchanges, offering 180+ filters spanning technical and fundamental criteria. Its pattern recognition engine detects 59 chart formations — 29 technical patterns and 30 candlestick formations — and rates each detected pattern on a 0–10 scale based on how cleanly the stock matches the formation criteria. Plans start at $34.97 per month with 15-minute delayed data.
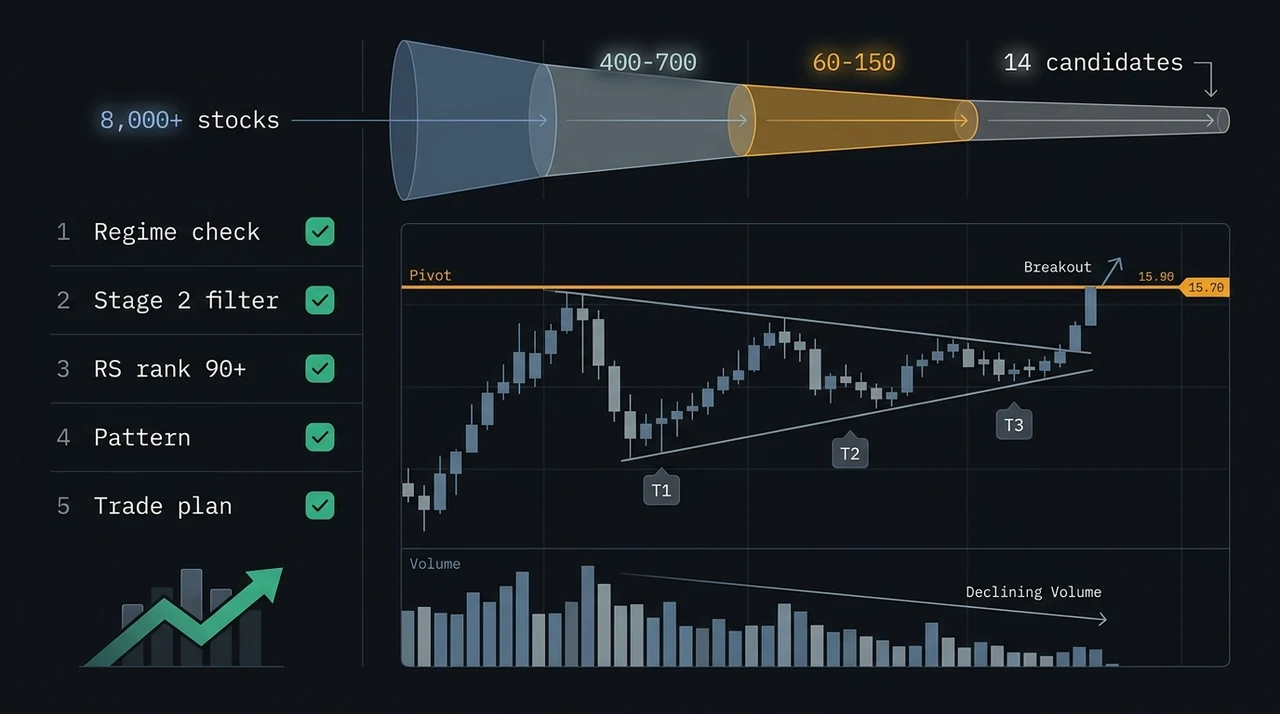
EasySwing.trading scans 2,000+ US stocks for 13 named swing trading setups — VCP Breakout, Trend Pullback, 52-Week-High Proximity Pullback, MA Stack Confluence, ADX Trend Momentum, HHV Breakout, ROC Breakout, RSI(2) Leader Dip, and Snapback Z-Score. Each result carries a letter grade (A+/A/B+/B/C), a composite score (0–100), pre-calculated entry price, stop-loss, and two profit targets. Plans start at $49 per month ($39/month with annual prepay) with twice-daily scans at approximately 2pm ET (midday) and after market close.
The architectural choice: ChartMill's 59-pattern catalog searches for any detectable formation across multiple markets. EasySwing.trading runs 13 specific US-focused strategies, each with a structured quality assessment and a market regime condition that must be satisfied before the result appears.
The Screening Model: Pattern Detection vs Strategy Detection
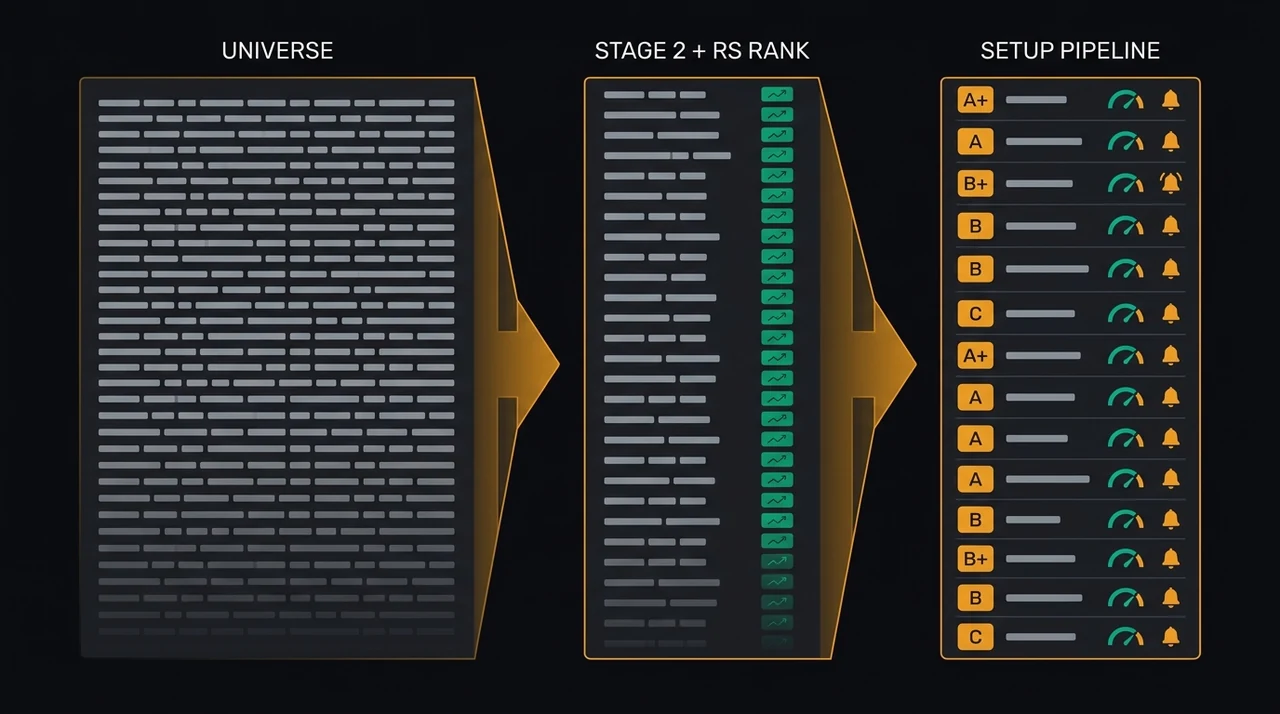
ChartMill returns stocks whose price action matches one of its 59 pattern definitions, rated on formation quality. EasySwing.trading returns stocks that clear a seven-layer evaluation — trend phase, RS rank, volume confirmation, named pattern, and regime gate — ranked by a composite score that combines all five dimensions. Pattern selection and methodology remain with the trader in ChartMill; they are built into the engine in EasySwing.trading.
ChartMill's approach is breadth-first: scan for any pattern in its library and return matches rated by how well the stock's price action fits the shape. Pattern selection — deciding which of the 59 formations is relevant to your methodology — is the trader's job. The 0–10 score tells you how clean the formation looks, not how strong the broader setup quality is.
EasySwing.trading's approach is depth-first: run 13 specific setups encoding the Minervini/O'Neil methodology and return scored, ranked results ready to act on. The 0–100 composite score weights five factors:
| Factor | Weight | What It Measures |
|---|---|---|
| RS rank | 30% | Relative price strength vs. the broad market |
| Momentum score | 25% | Rate of price acceleration over 20 and 60 days |
| Volume confirmation | 20% | Relative volume vs. 50-day average at the trigger |
| Pattern quality | 15% | How closely price action matches the strategy definition |
| Regime alignment | 10% | Whether the current market regime supports this strategy |
Mark Minervini describes the underlying principle in Think and Trade Like a Champion (2017): "Every minute you spend reviewing a mediocre setup is a minute not spent on an exceptional one." The scoring model surfaces exceptional setups automatically, so the trader starts from a graded shortlist rather than raw pattern matches.
ChartMill can tell you a cup-and-handle formation was detected with a quality score of 8. EasySwing.trading can tell you the detected Cup and Handle scored 74/100, carries a B grade, has an RS rank of 91, and should be treated with caution because the current market is in a Ranging regime. For the indicator framework underlying the composite score, see Best Indicators for Swing Trading: The 5 That Actually Work.
Market Regime Awareness
ChartMill applies no market regime filter — its 59-pattern scan runs with identical output regardless of whether the market is in a bull run or correction. EasySwing.trading classifies market conditions into five regimes and gates each strategy against the current state, adjusting which setups are promoted and which carry caution flags in real time.
Regime context matters because the same chart pattern produces different follow-through rates depending on market conditions. Andreas Clenow documented in Stocks on the Move (2019) that momentum strategies returned approximately a 58% win rate in trending markets versus 43% in non-trending environments — a 15-percentage-point shift driven entirely by market state. Without a regime filter, pattern alerts fire in both conditions with equal confidence.
ChartMill has no regime engine. Its detection runs identically whether the SPY is in a confirmed uptrend, a correction, or sideways range.
EasySwing.trading classifies the market into five regimes — Trending Up, Trending Down, Ranging, High Volatility, and Transitioning — using index breadth, VIX readings, ADX, and price structure. Each strategy is gated by regime:
- In Trending Up: VCP, Cup and Handle, and Trend Pullback setups are promoted; short setups display caution
- In Ranging: Snapback Z-Score and RSI(2) Leader Dip setups are promoted; breakout strategies reduce output confidence
- In Trending Down and High Volatility: long breakout and momentum setups carry reduced confidence and lower output until conditions stabilize
For the full five-regime framework, see Market Regime: How to Read Bull, Bear, and Choppy Markets.
Alerts and Notifications
ChartMill offers price-threshold alerts, earnings alerts, news alerts, and insider trade alerts across its screened universe. EasySwing.trading delivers strategy-based Telegram alerts that encode the full multi-condition logic of each strategy — including regime gate, grade threshold, RS rank minimum, and pre-calculated entry/stop/target — directly to your phone at the moment the setup qualifies.
ChartMill's alert model is condition-based: set a price level, a pattern detection event, or an earnings date and receive a notification when it triggers. The broader setup context — regime fit, RS rank, volume confirmation — is not encoded into the alert. You receive a notification that a condition was met; the rest of the analysis is still manual.
EasySwing.trading's alert model encodes the full strategy logic. A VCP Breakout alert fires only when the stock clears pattern detection, minimum grade threshold, RS rank minimum, and the current regime supports the strategy. The alert payload includes entry price, stop-loss, and two profit targets — ready to evaluate without additional chart review.
Telegram delivery brings the alert directly to your phone with the complete setup context at the moment it triggers. For the five-condition alert framework and per-strategy configuration, see How to Set Up Swing Trading Alerts: A Strategy-First Approach.
Where ChartMill Holds the Advantage
ChartMill's 59-pattern catalog, 180+ filters covering fundamental data, and European market coverage give it a breadth advantage EasySwing.trading does not match. Three areas where ChartMill holds a clear edge:
1. Pattern catalog breadth. ChartMill's 59 patterns include 30 candlestick formations — hammer, doji, engulfing, shooting star, and 26 more — alongside 29 traditional chart patterns. For traders who want to detect a specific candlestick event rather than a multi-week strategy setup, ChartMill's catalog is substantially broader.
2. Fundamental filter depth. ChartMill's 180+ filters include P/E ratio, forward P/E, revenue growth, EPS estimates, debt-to-equity, and analyst ratings as stand-alone parameters. EasySwing.trading encodes earnings quality (EPS acceleration) into its strategy grades, but does not surface these as independent filter criteria. Traders who use fundamental valuation metrics as a primary screen will find ChartMill's depth essential.
3. International market coverage. ChartMill covers US, Canadian, and European exchanges. EasySwing.trading focuses exclusively on US equities in the $200M–$20B market cap range. Non-US traders, or US traders who also monitor European or Canadian stocks, will need ChartMill's multi-market access.
Who Each Tool Fits
ChartMill fits swing traders who:
- Want a catalog of 59 patterns including candlestick formations alongside traditional chart patterns
- Need fundamental filters (P/E, EPS, revenue growth) as primary screening criteria
- Trade US, Canadian, or European markets from a single platform
- Are still refining which pattern types match their methodology
- Prefer lower-cost access with 15-minute delayed data
EasySwing.trading fits swing traders who:
- Follow the Minervini/O'Neil methodology and want 13 named setups built around those criteria
- Want a quality grade (A+/A/B+/B/C) and composite score on every result, not just a pattern-match indicator
- Need regime-aware scanning where breakout signals adjust based on market conditions
- Want strategy-based Telegram alerts with pre-calculated entry, stop, and targets on every trigger
- Trade US equities and want the full setup-detection workflow consolidated in one tool
Some traders use both: ChartMill for fundamental screening and candlestick review, EasySwing.trading for final strategy selection, scoring, and alert configuration. For a broader comparison landscape, see EasySwing vs Finviz and EasySwing vs TradingView.
EasySwing.trading vs ChartMill: Feature Comparison
| Feature | EasySwing.trading | ChartMill |
|---|---|---|
| Strategy catalog | 13 named setups | 59 patterns (29 technical + 30 candlestick) |
| Setup quality scoring | A+/A/B+/B/C grade + 0–100 composite | 0–10 formation quality score |
| Pre-calculated entry/stop/target | Yes | No — manual |
| Market regime gating | Yes — 5-state engine | No |
| RS rank filter | Yes — built into all strategies | Available as stand-alone filter |
| Fundamental filters | Embedded in strategy grades | 180+ stand-alone parameters |
| Alert type | Strategy-based (full condition set) | Price, earnings, news, insider |
| Telegram delivery | Yes | No |
| Data delay | Twice-daily scans (real-time enrichment) | 15-minute delayed |
| Market coverage | US equities only | US, Canada, Europe |
| Price (monthly) | $49/month ($39 annual) | $34.97/month |
Screener Selection Checklist
- ✅Use EasySwing.trading if you want regime-gated, pre-scored strategy results with Telegram alerts
- ✅Use EasySwing.trading if you follow the Minervini/O'Neil methodology and want 13 named setups that encode those criteria
- ✅Use EasySwing.trading if you want pre-calculated entry, stop, and target on every result
- ✅Use ChartMill if you need fundamental filters (P/E, EPS, revenue) as primary screening criteria alongside technicals
- ✅Use ChartMill if you want candlestick pattern detection alongside traditional chart patterns
- ✅Use ChartMill if you trade European or Canadian markets alongside US equities
- ❌Don't treat any screener result as a trade signal — screener output is a starting point for your own analysis
- ❌Don't run momentum breakout scans without checking the current market regime first
Frequently Asked Questions
Is EasySwing.trading better than ChartMill for swing trading?
For traders using a named-setup methodology — VCP, trend pullback, MA stack confluence — EasySwing.trading's regime-gated, quality-scored results reduce manual review at each step. ChartMill's broader pattern catalog and fundamental filter depth suit traders who screen across multiple styles, require candlestick formation detection, or need international market coverage.
Can ChartMill detect the same setups as EasySwing.trading?
ChartMill can detect the underlying chart formations that correspond to some EasySwing strategies. The structural difference: EasySwing.trading's engine evaluates each result simultaneously across RS rank, momentum, volume, pattern quality, and regime — producing a graded, scored result with pre-built risk/reward. ChartMill returns a pattern match with a formation quality score from 0 to 10.
Does EasySwing.trading cover European stocks?
No. EasySwing.trading scans US equities with market caps between $200M and $20B. For European or Canadian market coverage, ChartMill's international data is a material advantage.
What does EasySwing.trading offer that ChartMill does not?
A five-state market regime engine that gates strategy results by current market conditions, strategy-based Telegram alerts that encode the full multi-condition logic, pre-calculated entry/stop/target levels on every result, and a composite 0–100 score weighted across RS rank, momentum, volume, pattern quality, and regime alignment.
Can I use both ChartMill and EasySwing.trading together?
Yes. ChartMill's fundamental filters and 59-pattern catalog can serve as an initial universe-narrowing step. EasySwing.trading's regime-gated strategy detection and quality grading add the final layer — identifying which stocks in your shortlist are currently in a named, scored setup aligned with market conditions.
EasySwing.trading screens for swing trading setups across 2,000+ US equities automatically — detecting VCP, Cup and Handle, trend pullback, and momentum breakout patterns with regime gating and composite quality scoring on every result. For a broader screener comparison, see EasySwing vs Finviz and Stock Screener for Swing Trading: How to Find High-Probability Setups. Scan results are for informational purposes only. See our Risk Disclaimer.
Disclaimer: This article is for educational purposes only and does not constitute investment advice. EasySwing is a stock screening tool, not a registered investment advisor. All trading involves risk. Read our full disclaimer →